|
Preferences Setting
|
Contents of Preferences Dialog
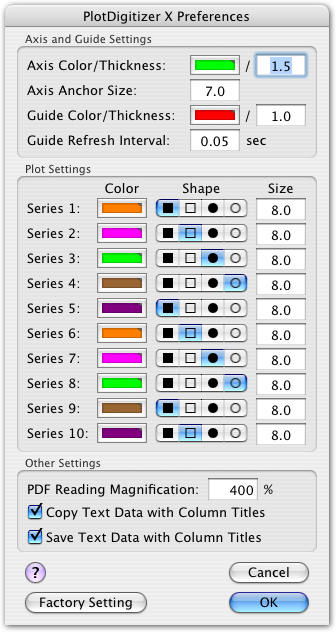
[PlotDigitizer X - Preferences] menu opens a preference setting dialog shown below.
These settings are common to all documents, and changes are immediately applied to opened documents.
These are settings for axis and guide line display.
- Axis Color/Thickness
- This sets the color and thickness of axis lines.
Click on the colored area to change the color.
Line thickness accepts a value between 1 and 5.
- Axis Anchor Size
- Anchor size for axis setting.
A value between 3 and 15 is acceptable.
- Guide Color/Thickness
- This sets the color and thickness of cursor guide lines during plot digitizing.
Click on the colored area to change the color.
Line thickness accepts a value between 1 and 5.
- Guide Refresh Interval
- This is a time interval for checking mouse position and refresh guide lines during digitizing.
A value between 0.01 and 0.2 seconds is available.
If this time is too long, movement of the guides is jerky.
While it is too short, system load becomes too high, as a result response becomes worse.
This setting depends on your Mac's performance.
These are setting of plot markers for each series.
- Color
- Color of corresponding series marker.
Click on the colored area to change the color.
- Shape
- There are 4 choices of marker shapes; filled square, open square, filled circle and open circle.
- Size
- Size of corresponding series marker.
A value between 3 and 15 is acceptable.
- PDF Reading Magnification
- This sets magnification value when PDF file is read.
100 % corresponds to a resolution of 72 dpi.
The higher magnification, the higher resolution but slower performance.
Usually, embedded images in a PDF file has about 300 dpi, therefore 400 % is a reasonable maximum of this value.
A value between 100 and 800 is acceptable.
This setting is not applied to existing documents but to the future reading of PDF files.
- Copy Text Data with Column Titles
- If it is checked, column titles are attached to the first line of copied text data.
If this is not favorable to a graphing software to paste, uncheck it.
- Save Text Data with Column Titles
- If it is checked, column titles are attached to the first line of saved text data.