|
|
Digitizing Plot Data |
 command + drag
 command+option + click command+option + drag
 command+option+shift + click command+option+shift + drag
 /
/ command+1/ command+2
In this section, useful and effective keyboard shortcuts for plot digitalization is explained.
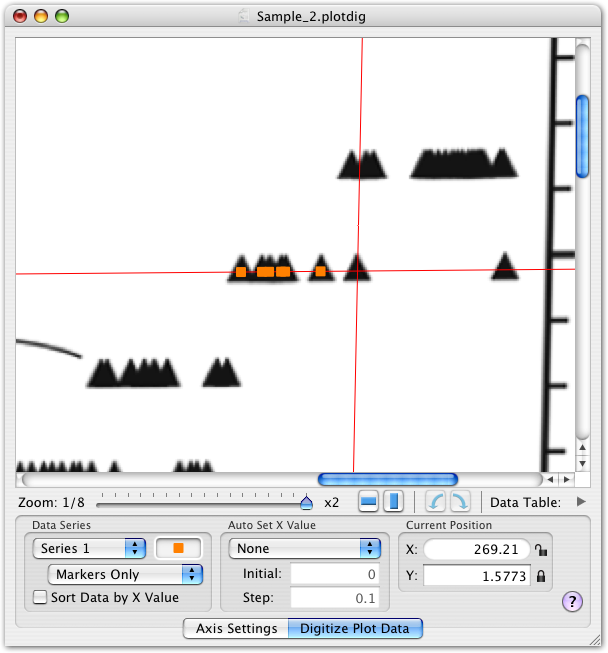
command + drag command+option + click command+option + drag command+option+shift + click command+option+shift + drag/ command+1/ command+2When you finish setting up axis positions, choose [Digitize Plot Data] tab at the bottom of the window. The bottom area changes as shown below and red cursor marker is shown on the image instead of the green axis lines (cursor marker only appears when mouse cursor is in the image area). The corresponding data coordinates are shown in the [Current Position] area on the right-bottom corner.
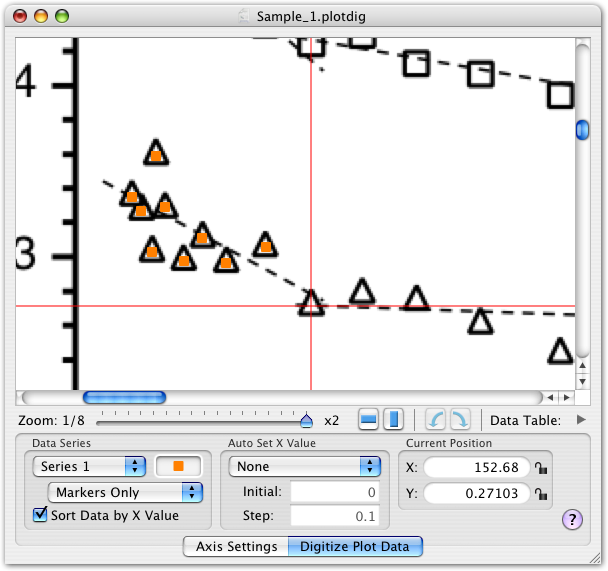
Click on a plot point makes a digitized data and the data is appended to the data table (the table is omitted in the above figure). You can choose a data series by a menu at left-bottom side of the window. You don't need to choose a series in turn, but empty series is ignored when copying or saving in text format. There is no limit of numbers of rows in a series. If the checkbox [Sort Data by X/θ value] is checked, you can get a sorted series regardless of order of reading points. Marker drawing is also selectable from [Marker Only]/[Markers w/Lines]/[Lines Only] menu. The line choice makes connecting lines between markers. Marker colors, shape and size can be customized in the preferences setting.
If different series of data have different axis settings (such as left axis and right axis, or different graphs in one PDF page), you can change the axis setting after digitizing the first series. Axis settings for different series are independent each other, however, you can not append data with different axes into the same series.
During digitizing operation, [Edit - Undo] and [Edit - Redo] works as well. There is no limit of number of undo operations, but once you entered the axis setting mode, you can not undo anymore.
You can delete a selected series in the data table by [Edit - Delete] or delete key. Since you can not select a part of rows in a series, you can not delete a part of data in a series.
[File - Save] menu creates a file with ".plotdig" extension, which is a document file exclusively for PlotDigitizer X. The PlotDigitizer document includes the image data and axis setting as well as digitized data. You can interrupt digitizing and resume with this document.
You can export digitized data as a tab delimited text file using [File - Save Data as Text] menu. The saved file has ".txt" extension and is in a generic text format, so that you can read it from a spread sheet application, or a graphing application etc. You can also select series in the data table and choose [File - Save Selection as Text] menu to save a part of the data. Since you can not select a part of rows in a series, you can not save a part of data in a series.
The most convenient way of data sharing is copy and paste with [Edit] menu. Before you copy data, you should select them in the data table.
At the top line of the saved or copied text, column titles such as "Series_03_x" are attached. If you don't need these column titles, turn off a corresponding checkbox in the preferences setting.
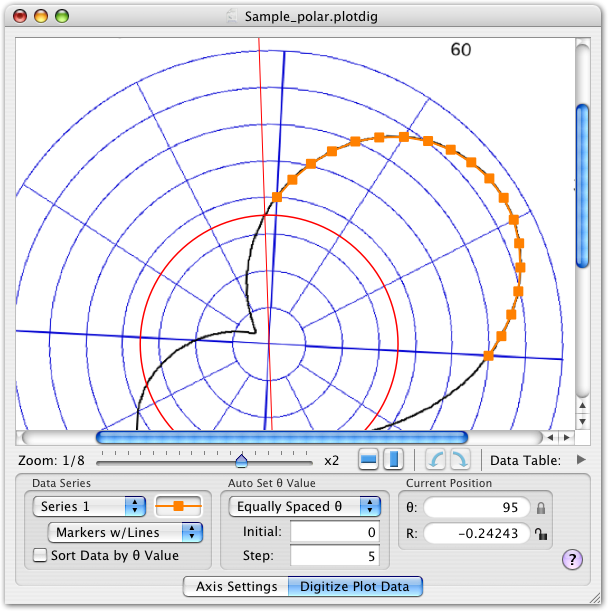
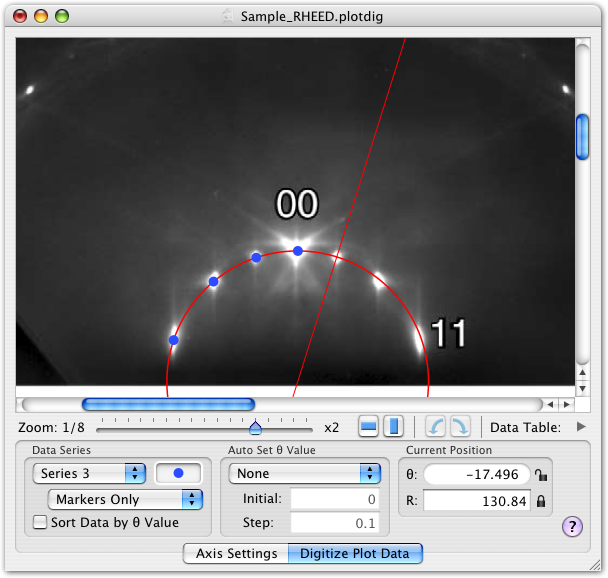
Although PlotDigitizer X has no automatic tracing function, [Auto Set X/θ Value] function is very useful to trace a line graph manually. Choose a menu [Equally Spaced X/θ] at the middle of the window and input an initial value and step value, then X/θ value is automatically fixed according to current row number of the current series. In this mode, only Y/R guide line can move with the mouse cursor. Below is an example of a graph in polar coordinate, which is setup with reading R value for every 5°. If there are already data in the series when you choose the menu, this function only applies to newly digitized data. In this case, for example, there are 4 data in the series, the initial value is chosen as (initial + step × 4).
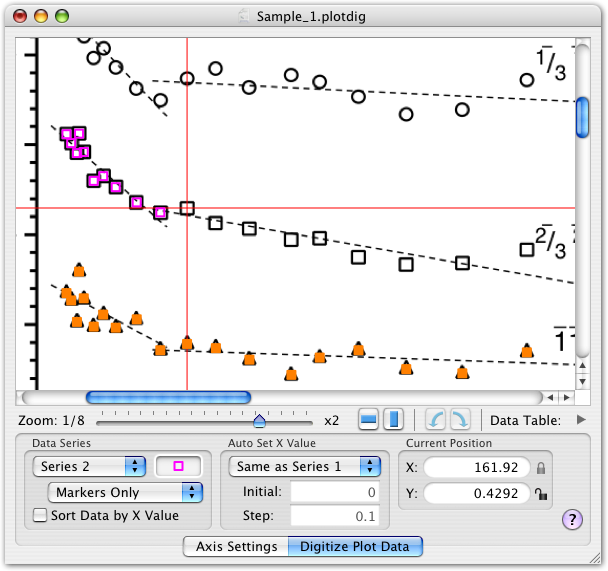
In many cases of a graph with several data series, all series shares the same X values. [Same as Series 1] function works efficient in this case. At first, digitize data of the series 1 as usual, and then choose this menu (you can choose this menu before you digitize the first series). Next you need to do is just choose the next series, and X/θ value is automatically chosen as same as that of the series 1. Below is an example with three series with shared X values. When the current row number exceeds that of the first one, X/θ value is fixed at the minimum value of the axis in the axis setting. It is possible to append more rows than the first one if you choose [None] in the menu. If there are already data in the series when you choose the menu, this function only applies to newly digitized data.
It is possible to lock X/θ and/or Y/R axis manually to click on lock icons aside of the current value fields. If it is locked, the icon changes to locked one and the current field accepts editing. In most cases you do not know the exact axis value to lock, keyboard shortcuts (command-1/2) explained in the first section of this topic work efficient.
This software is mainly aimed to read plot points, it is also usable to read coordinates of experimental images as shown below. In this case, axis value setting should be coincides with pixel value. For rectangular coordinate, you can setup the axis using [Covers Whole Image] button to fit the pixel size and the axis size. For polar coordinate, you can refer to radius size shown in the information panel explained in the next section.
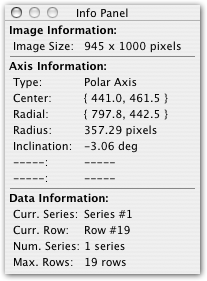
Information panel shows detail information about the image loaded, axis settings and digitizing status. The information panel displays the information of the frontmost document. The figure below shows an example of the panel for a document with parallelogram coordinate. [Anchor LB] shows the left-bottom axis anchor position, [Anchor RB] is that of right-bottom one etc. [Bottom Len.] is the distance between [Anchor LB] and [Anchor RB], [Left Len.] is that between [Anchor LB] and [Anchor LT]. [Curr. Series] and [Curr. Row] mean the current digitizing series and row number. [Num. Series] is a number of series with data, and [Max. Rows] is the maximum number of rows of all series.
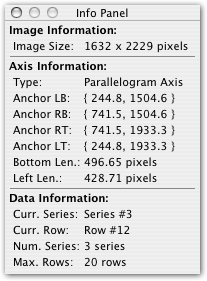
For a polar coordinate, most of the information is similar as shown below. In this case, axis radius and inclination is shown in place of anchor distance.