|
|
Axis Settings |
 command + drag
 command+option + click command+option + drag
 command+option+shift + click command+option+shift + drag
 command+control + drag
In this section, useful and effective keyboard shortcuts for axis setting is explained.
command + drag command+option + click command+option + drag command+option+shift + click command+option+shift + drag command+control + dragPlotDigitizer X supports the following three coordinate system.
The document window is like a figure below just after image reading (only an image zooming is adjusted to see whole image).
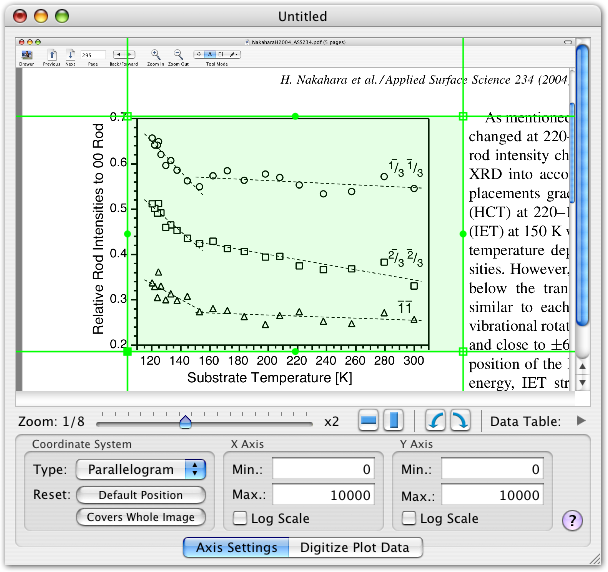
Green four lines and rectangular area shows the default axis position. The bottom edge and the left edge correspond to the X and the Y axes.
To change image scaling, drag the zoom slider which can zoom the image from 1/8 to 2 times of the original pixel size. Two buttons with rectangles zoom the image to fit window width or height in one action. Rotated arrow buttons can rotate the image left or right hand by 90°. The right most triangular button opens or closes a drawer in which digitized data coordinates are shown (the table drawer may appear at the left side of the window if there is no room at the right side). The width of the data table drawer can extend or shrink by dragging the right edge of the drawer. Most of the above operation can be accessed via [View] menu.
When your target graph is only a part of a large image, digitizing work is inefficient. You can trim an image with a keyboard shortcut of command-control-drag as described in the first section of this topic.
A box anchor at a corner of the green lines can move positions of the corresponding corner point. Transparent green area can shift the area position. A circular anchor at the middle of the line can shift the corresponding edge. During axis positioning, [Edit - Undo] and [Edit - Redo] menu acts as well. There is no limit of number of undo actions, but once you moved to the digitizing mode, no undo action is allowed.
Axis positions are reset to the default position when [Default Position] button is pressed. It is useful when you moved the axis away from the image area. Press [Covers Whole Image] button makes the axis to cover whole image area. In addition, it sets axis values to fit the axis size and image pixel size. You can use this function when you want to read pixel positions of experimental photographs etc.
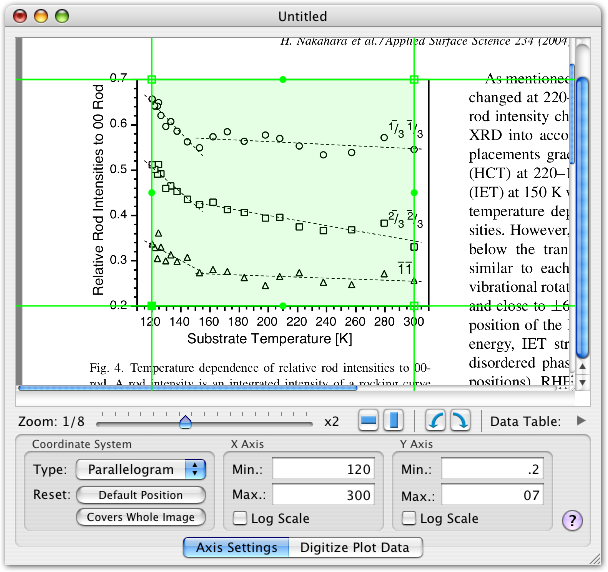
Below figure is an example of setting correct axes for a graph. In the figure, minimum/maximum values of both axes were also inputted. For logarithmic axis, check [Log Scale] checkbox of the corresponding axis.
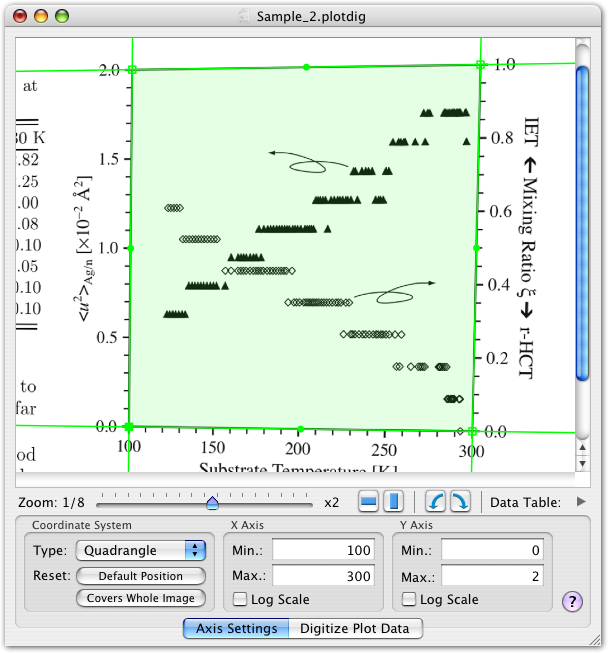
Coordinate system selection menu at the left bottom chooses a coordinate system explained above. The way of quadrangular axis setting is almost the same as that of the parallelogram one, except that the right-top anchor can move independently on other anchors. An example of the quadrangular coordinate setting is shown below.
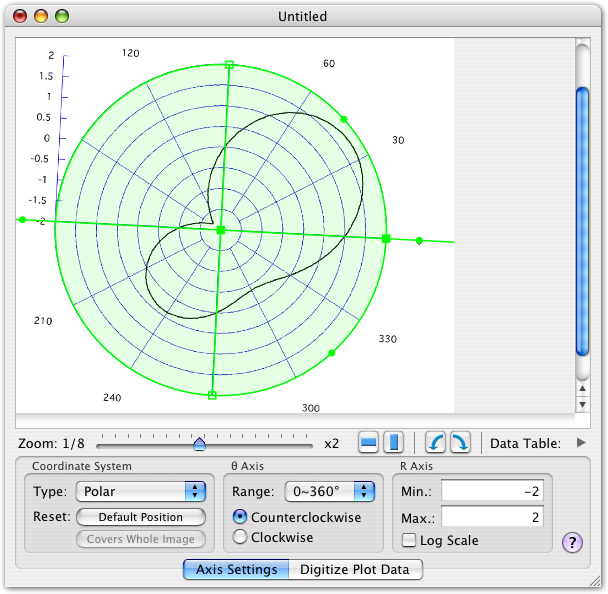
When you choose a polar coordinate, default axis is as follows.
A filled square anchor at the right side of the center anchor indicates the angle reference direction. This anchor or another two open squared anchors on the crossed line can move angle reference and the radius of the area at the same time. Circular anchors on the angle reference line can change the reference direction only. Tow other circular anchors on the main circumference can change its radius only. Dragging the circular area shifts its position.
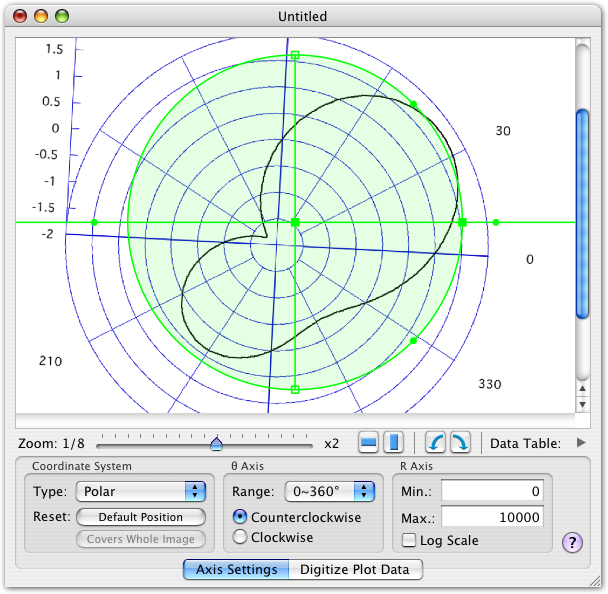
An example of the polar coordinate setting is shown below. In this figure, minimum/maximum values of the R value is also set. You can also choose logarithmic scale for the R axis. For the θ axis, you can choose one of [0〜360°], [±180°], [0〜2π], [±π] choices for the measurement range. The reference direction is always 0 for all choices. You can also choose measurement direction of angle from [clockwise] or [counterclockwise].